Monitoring and drift
Check whenever you like, spot what is drifting.
A system doesn’t always fail all at once: often it produces a little less each month. Anolis shows you that slope before it gets expensive.
You check whenever you want, and you see drift coming.
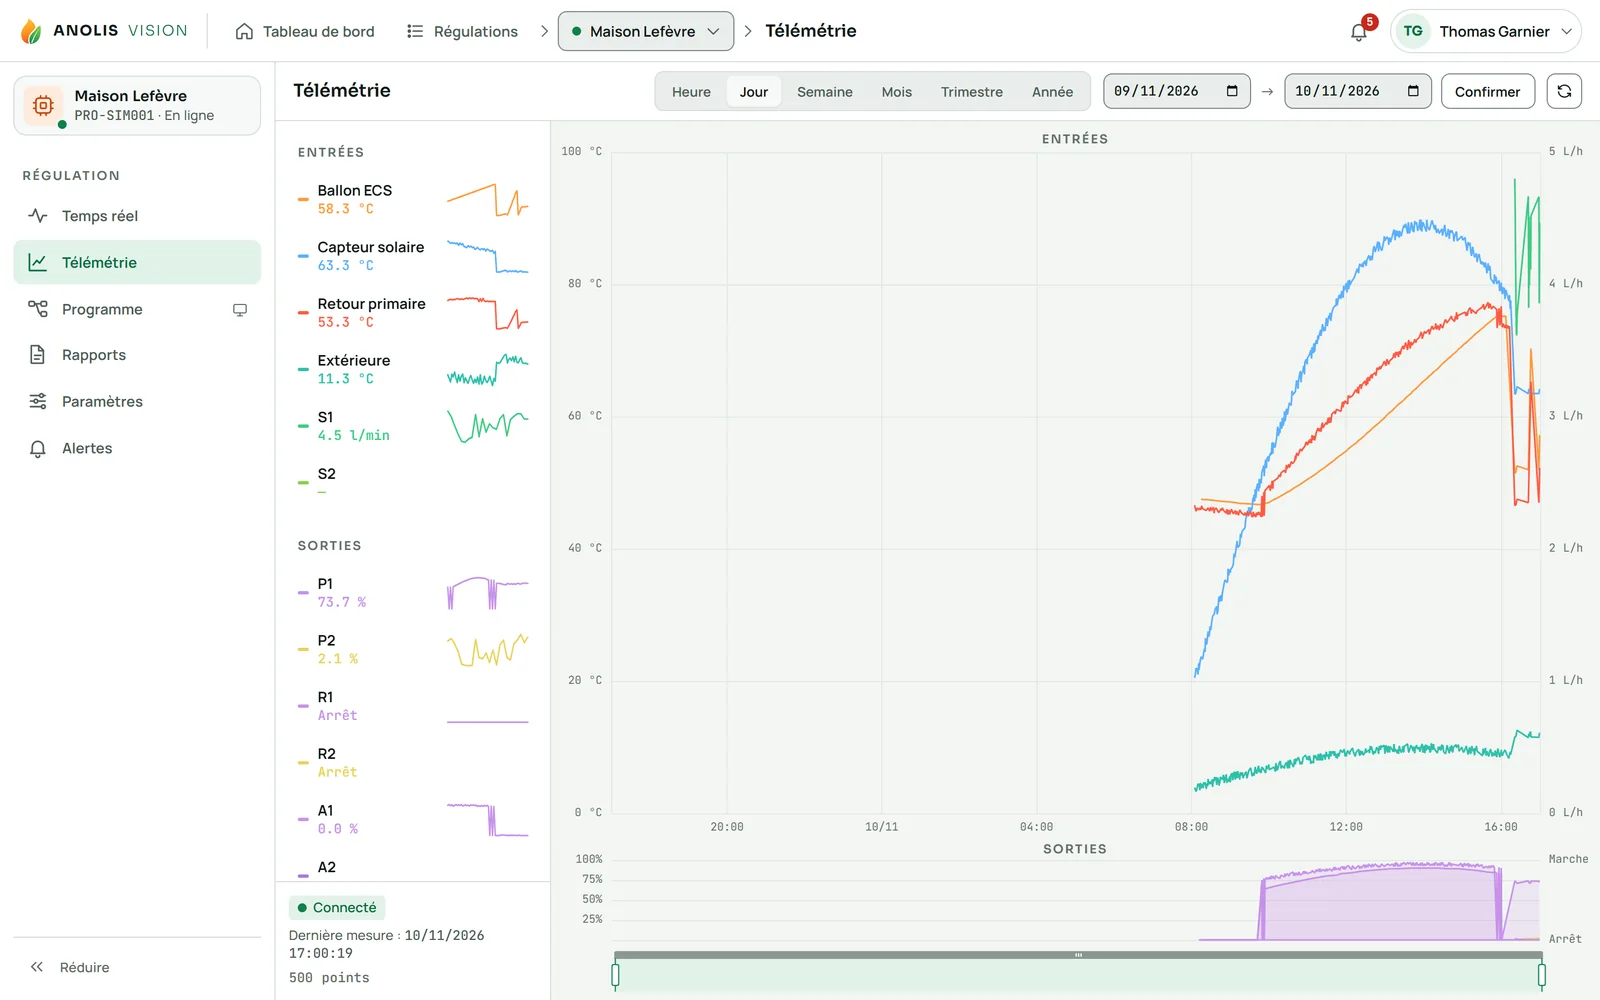
Live data
Temperatures, flow rates, pumps and power, live. During commissioning, values refresh every second.
Charts that respond
Two synchronised levels, scroll-wheel zoom, comparison of two periods.
Drift, measured
Yield compared from one period to another and correlated with the weather: you know whether a drop comes from the sky or the system.
Nothing is lost
Up to 7 days of readings kept in the controller if the internet goes down, and up to 10 years of history in Anolis Vision.
Conventional controller or Anolis
You check whenever you want, and you see drift coming.
| — | Conventional controller | Anolis |
|---|---|---|
| Viewing the system | On site, in front of the box | Anywhere, on computer and phone |
| History | None, or a memory card to collect | 1 to 10 years depending on plan |
| Production drift | Visible once it fails | Tracked month after month |
| Comparing two periods | Impossible | Synchronised charts, zoom |
| Commissioning | Values read one by one | Live mode, every second |
What you spot with it
What you spot with it
- A collector getting dirty: yield falls by a few percent each month
- A badly set valve: the tank never goes above 50 °C
- Backup heating that starts too early in the morning
- A pump running at night for no reason
FAQ
Frequently asked questions
How long is data kept?
1 year with the Free plan, 5 years with Standard, 10 years with Pro.
Can readings be exported?
Yes, charts and readings can be exported to work on them in a spreadsheet.